Interactive Dashboards Is Here
Interactive Dashboards Is Here

Ever wished you could make sense of complex financial data in seconds? Whether you're tracking global economic trends, comparing currency exchange rates, or looking for AI-powered investment insights, having an interactive dashboard makes all the difference. That’s exactly what we built — a Python-powered analytics dashboard that transforms raw numbers into clear, actionable insights.
Let’s take a look at what makes it special.
Effortless Data Visualization
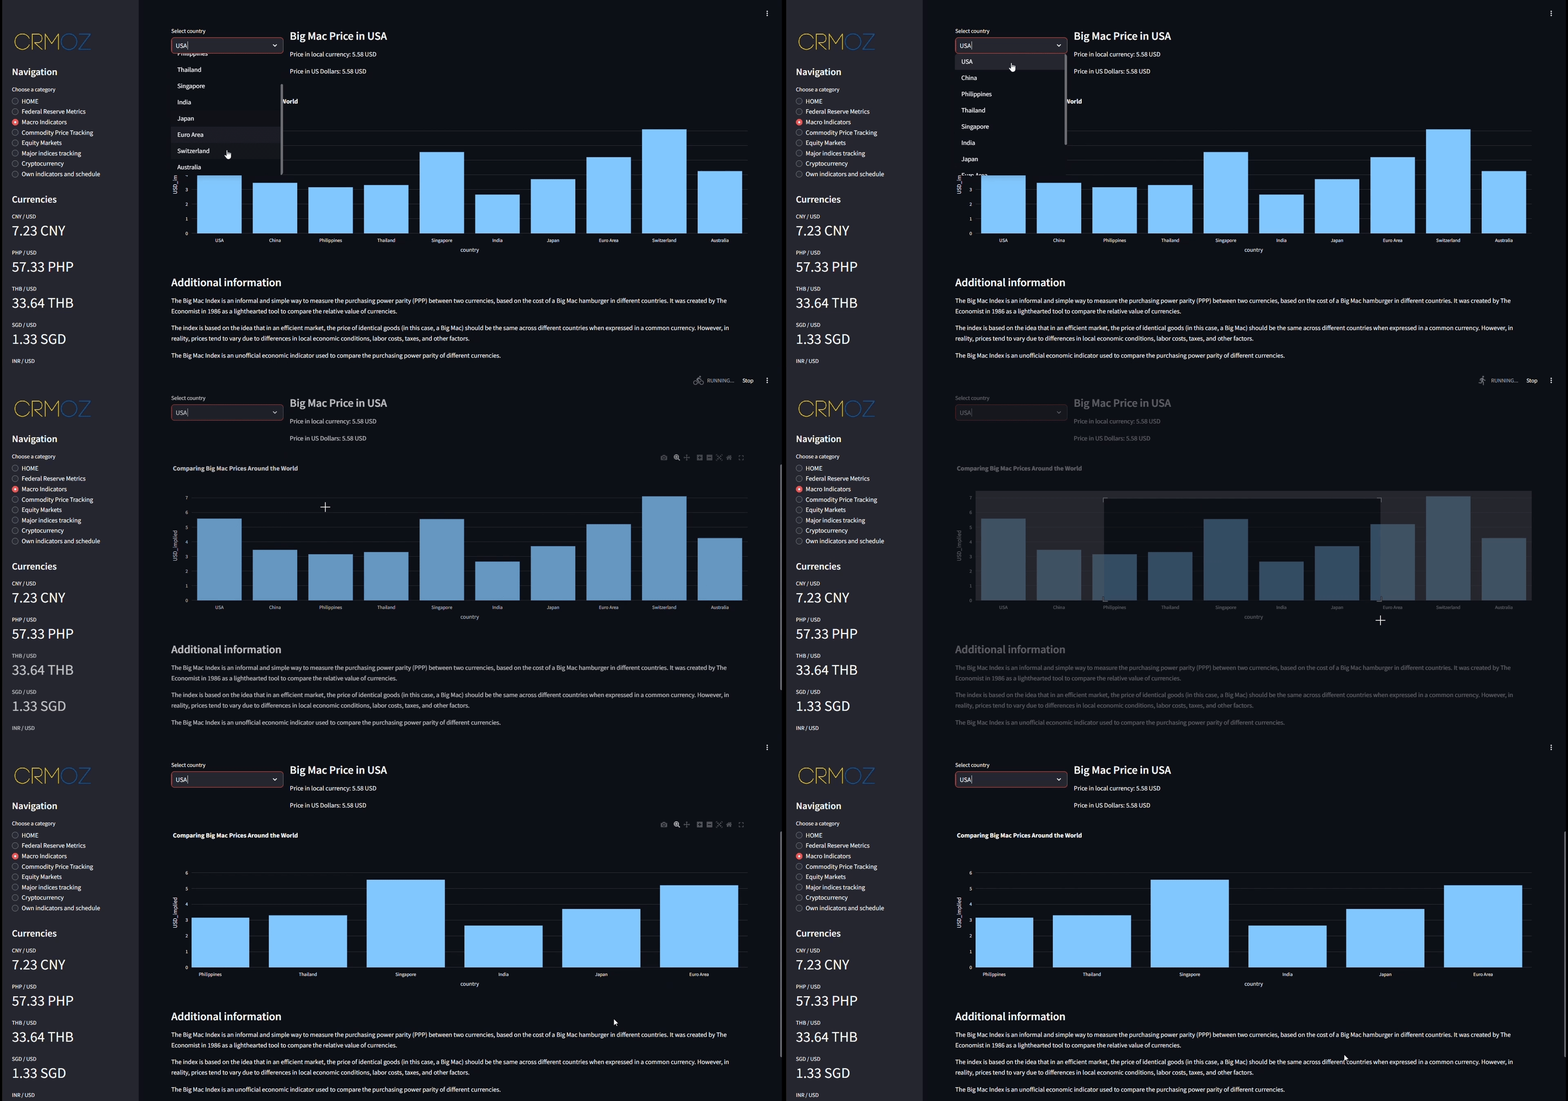
At its core, this dashboard is all about simplicity and interactivity. It pulls together real-time financial data from multiple sources and presents it in a clean, visual format.
🔹 Compare multiple countries—track economic indicators and trends across different regions.
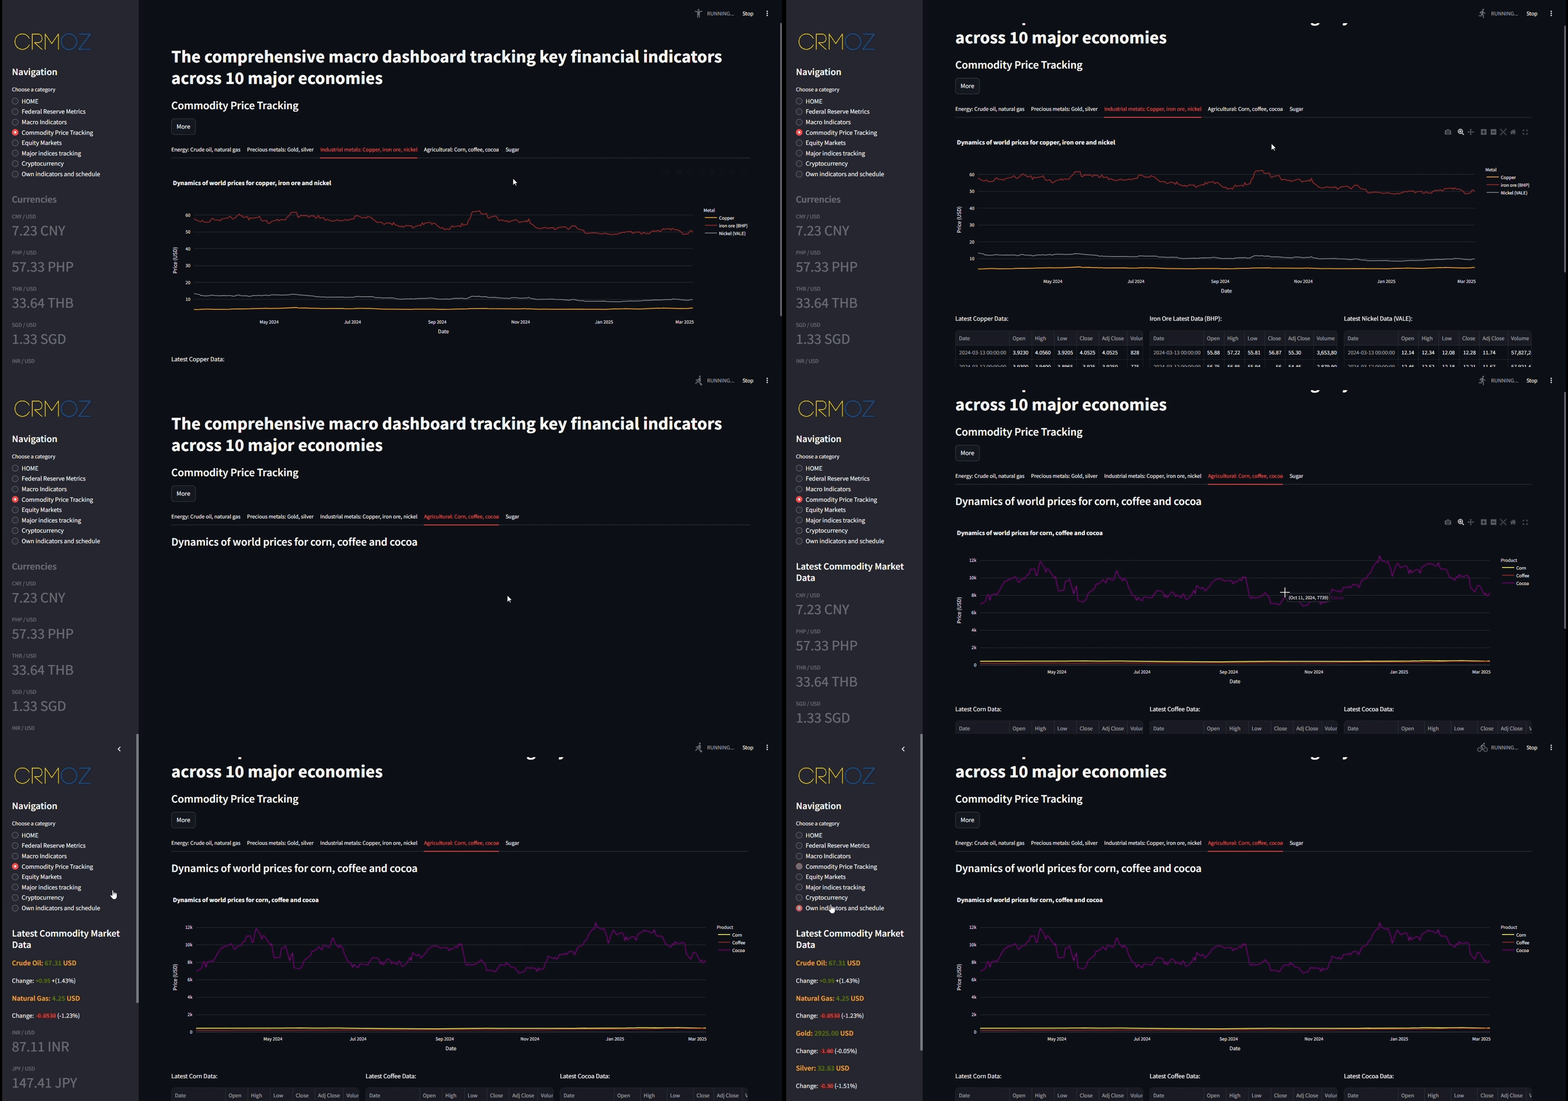
🔹 Dynamic graphs & tables—adjust, filter, and download data with just a few clicks.
🔹 Currency & inflation tracking—monitor exchange rates and inflation levels over time.
🔹 AI-powered market insights—get recommendations on when to buy, sell, or hold assets.
Everything is interactive—you can zoom in on specific data points, select time frames, and even switch between light and dark mode for a customized experience.
AI That Does the Heavy Lifting
Manually analyzing financial trends can take hours. That’s why we built an AI-powered analysis tool right into the dashboard.

Built for Flexibility
The dashboard isn’t just for viewing data—you can upload your own files (Excel, CSV, Google Sheets, MySQL, etc.) and analyze them instantly.
✔️ Customize graphs, time frames, and indicators to fit your needs.
✔️ Track cryptocurrency trends in real-time, with updates every 30 seconds.
✔️ Integrate with web scraping tools to pull in fresh data automatically.
And because it’s built with Python and React, it’s fast, reliable, and ready to scale.
Why This Matters?
In today’s data-driven world, having access to the right information at the right time is a game-changer. This dashboard makes it effortless to analyze trends, spot opportunities, and make informed decisions—whether you're an investor, economist, or business owner.
🚀 Want to see it in action? Let’s talk about how we can tailor this solution for your needs!


